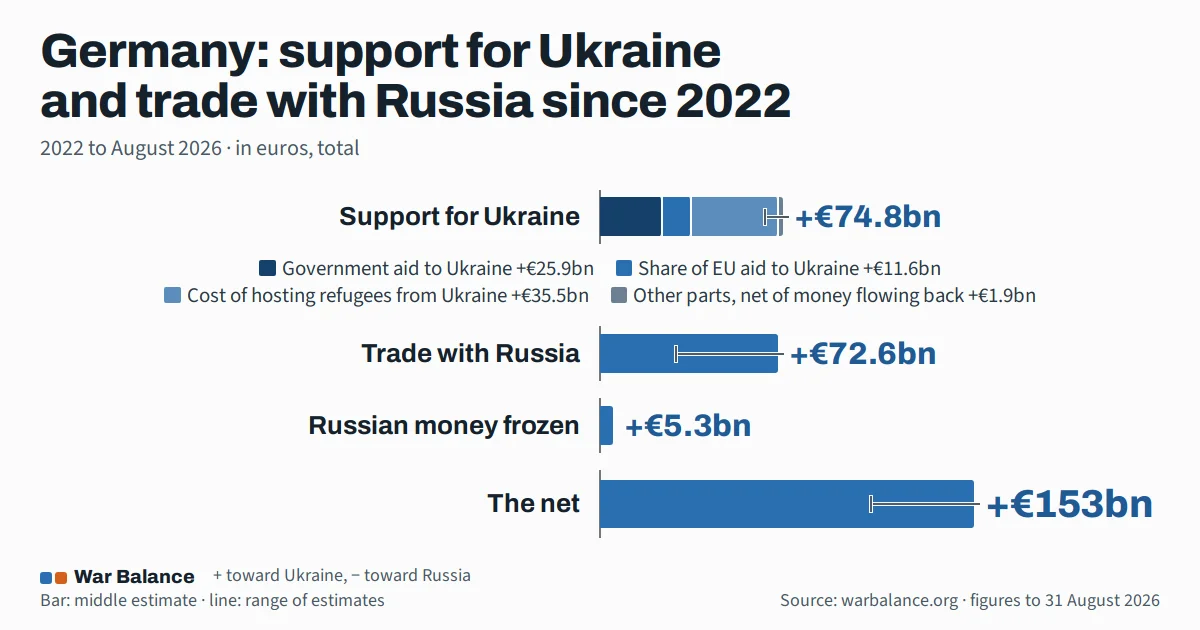
Germany has given Ukraine €74.8bn since 2022 (1.8% of GDP). Beyond its own aid, that total includes its share of EU aid (€11.6bn) and the cost of hosting refugees (€35.5bn). The Kiel Institute counts €30.8bn in bilateral aid.
Russia kept €72.6bn (1.7% of GDP) less than without the war, of which €21.9bn gas cut off by Russia; Russia also lost €5.3bn of return on Russian money frozen there. The net is 3.7% of GDP toward Ukraine.
Germany: aid to Ukraine and trade with Russia, 2022 to August 2026 (in euros)
Supported Ukraine + cut Russia's earnings from trade + froze Russian money = 3.7% of GDP toward Ukraine. About half support for Ukraine, half less kept by Russia from trade. Much of what Russia kept less is gas Russia cut off itself.
Chance toward Ukraine: >99%; 100% of the other method choices agree.
Support for Ukraine
Supported Ukraine with
1.8%
€74.8bn
likely 1.6% to 2.3% very likely · >99%
Trade with Russia
Cut Russia's earnings from trade by
1.7%
€72.6bn
likely 0.74% to 3.0% toward Ukraine very likely · >99%
Russia kept €72.6bn (1.7% of GDP) less than without the war, of which €21.9bn gas cut off by Russia.
Of which Russia's gain: Russia kept 1.5% of GDP less (€64.6bn; likely 0.56% to 2.8% toward Ukraine)
Of which Germany's own gain from trade with Russia: Germany kept 0.19% of GDP less from its trade with Russia (€8.0bn; likely 0.06% to 0.32% toward Ukraine)
The two lines add up to Russia's earnings from trade; their ranges do not.
Froze Russian money: Russia lost 0.13% of GDP in returns (€5.3bn).
Its story in short
Gas cut off by Russia Much of what Russia kept less is gas Russia cut off itself. Of which gas Russia cut off itself or that stopped with the end of transit: €21.9bn
War-time fuel prices Russia kept €16.5bn (0.39% of GDP) more because fuel prices rose with the war.
Bought 96% less from Russia What it bought from Russia, in euros at each year's prices: €35.7bn in 2021, €1.4bn in 2025. Only what Russia kept on it counts in the totals.
Sold Russia 65% less What it sold to Russia, in euros at each year's prices: €28.8bn in 2021, €10.1bn in 2025. Only what it kept on it counts in the totals.
Top-10 aid giver for its size Of its €74.8bn of support, aid (weapons, money, loans as gifts, its share of EU aid) is €40.6bn (0.97% of GDP), number 9 of 162 economies for its size.
What makes up the number
Supported Ukraine with 1.8% · €74.8bn
Hosting refugees C
+0.85%
€35.5bn
Aid: weapons, money, loans B
+0.62%
€25.9bn
Its share of EU aid B
+0.28%
€11.6bn
Undisclosed military aid D
+0.04%
€1.7bn
Private donations C
+0.03%
€1.3bn
Germany kept back part of its refugee spending C
−0.02%
€804m
Germany kept back part of its aid, spent at home C
−<0.01%
€252m
Ukraine kept more from extra sales here C
+<0.01%
€158m
Its share of IMF and World Bank loans C
+<0.01%
€133m
Germany kept more from extra sales to Ukraine C
−<0.01%
€110m
Germany kept more from extra services sold to Ukraine C
−<0.01%
€90m
Germany kept part of others' aid, spent here C
−<0.01%
€89m
Germany kept part of aid spent here (energy, rebuilding) C
−<0.01%
€46m
Cut Russia's earnings from trade by 1.7% · €72.6bn
Russia kept less from fuel and goods sold here C
+1.7%
€69.9bn
Russia kept more from war-time fuel prices C
−0.39%
€16.5bn
Its firms paid Russia less tax C
+0.13%
€5.4bn
Germany's companies made less profit in Russia B
+0.13%
€5.3bn
Russia kept less from its oil bought via other countries Down estimate
+0.10%
€4.3bn
Germany earned less from Russian oil and gas stakes D
+0.05%
€2.2bn
Russian owners kept less from their firms here C
+0.03%
€1.3bn
Germany kept less from selling to Russia C
+0.02%
€1.0bn
Germany earned an extra price from Russia because of sanctions C
−0.01%
€580m
Russia kept less from services sold here C
+<0.01%
€223m
Germany kept less from services sold to Russia C
+<0.01%
€145m
Germany kept more from shipping Russian oil D
−<0.01%
€51m
Froze Russian money: Russia lost 0.13% in returns · €5.3bn
Russia lost returns on its frozen money C
+0.08%
€3.1bn
Russian owners lost returns on assets frozen here D
+0.05%
€2.1bn
+ toward Ukraine, − toward Russia (in support for Ukraine, − is money it earned back or bought less from Ukraine than without the war). Letters: A reported, B measured estimate, C modelled estimate, D rough indication.
By year
The year with the largest net amount was 2023: +€38.3bn. Support for Ukraine rose from €14.7bn in 2022 to €18.7bn in 2025.
It bought €35.7bn from Russia in 2021 and €1.4bn in 2025 (−96%). It sold €28.8bn to Russia in 2021 and €10.1bn in 2025 (−65%). Before the war (2018–2021), fuel was 78.7% of what it bought from Russia. For Germany: €16.5bn paid above no-war prices, most of it in 2022, 93% of it on gas contracts. These are sales values at each year's prices; the totals count what the seller kept on them.
What it bought from Russia, by fuel
Germany's purchases from Russia, 2022 to August 2026, by fuel: by its own customs records (CIF), on the map's basis (the Russian border price, FOB) and by CREA's tracker (ship data). The map's figure is the total on the map's basis.
Fuel
Customs (CIF)
Map basis (FOB)
Tracker (CREA)
Quality
Crude oil
€11.7bn
€9.4bn range €7.1bn to €12.5bn
€10.4bn
A
Oil products
€9.8bn
€8.9bn range €6.7bn to €11.8bn
€6.4bn
B
Pipeline gas
€23.7bn
€21.7bn range €16.3bn to €29.2bn
€19.3bn
A
Coal
€1.5bn
€1.4bn range €1bn to €1.8bn
€970m
C (estimate)
Other goods
€15.2bn
€14.1bn
–
All goods
€61.8bn
€55.5bn
–
Quality by year: 2022: A, 2023: B, 2024: C, 2025: C, 2026, January to August: A. C and D are estimates.
Of what Russia kept less from its trade: 30% required by EU sanctions it agreed to as a member, 31% gas that Russia cut off itself or that stopped with the end of Ukraine's gas transit, 39% beyond what sanctions required.
Sanctions on Russia
Yes. As an EU member, Germany applies the EU's sanctions on Russia, which every member agreed to in the Council. It is part of the price cap coalition on Russian oil. Separately, Russia lists Germany as an “unfriendly” state (government order 430-r, 5 March 2022): that is Russia's own list of countries it acts against, not a sanction by Germany. Checked 27 October 2026.
Replacing Russian energy cost it about €34.5bn extra from 2022 (0.82% of one year's GDP). Russian oil bought at a war-time discount saved it about €1.4bn. Neither is in the totals: shown for information.
Russian money frozen
Russian money frozen: 0.13% of a year's GDP (€5.3bn; likely €3.7bn to €6.3bn): the return Russia lost on its central-bank reserves and on Russian private assets frozen here. Not a payment, so it is on its own line, added to the net only. The return on central-bank reserves splits into: return on reserves held here, €23m; share of the return on reserves held at Euroclear and Clearstream (allocated by share of EU aid), €3.1bn. The freeze is an EU decision, so 2/3 of the return on reserves held at Euroclear (Belgium) and Clearstream (Luxembourg) goes to all EU members by their share of EU aid, and 1/3 to the host.
Amounts frozen here, for context (the map counts the return Russia lost on them, not the amounts): Bank of Russia reserves immobilised: no public figure (estimate: about €210m); assets of sanctioned people and companies frozen: €5.3bn (2025, source).
Refugees from Ukraine
1,259,155 refugees from Ukraine, 15 per 1,000 residents. Refugees counted as of 2026. Counted as support for Ukraine: €35.5bn (0.85% of one year's GDP), the public cost of hosting refugees from 2022, after the host's gain on the work refugees do. For Germany: €36.9bn spent on refugees, less €1.4bn, its gain on the work refugees did here. That is about €7,316 per refugee per year (4,847,344 refugee-years).
Why this differs from the Kiel tracker
Kiel Institute's figure for its own aid: €30.8bn; counted here: €25.9bn — donated weapons at their market value; loans at their gift value, not their full amount; military aid counted when delivered, by August 2026. Loans, full amount: €16.9bn; Loans, grant equivalent: €7.5bn. Promised but not yet delivered, in the Kiel Institute's figures: €44bn. It is not counted here. Military aid allocated but not yet delivered is not counted: €6.1bn (Kiel's full allocation is the high end).
Why the government's own figure differs
Germany's federal government reports over €43.3bn in bilateral civil support and about €57.6bn in military support, as of 30 June 2026. Its military figure counts funds set aside for later years as well as what was delivered. It counts loans and guarantees at their face value. It leaves out its share of EU aid. Of the cost of hosting refugees it counts what the federal government paid, not the spending of states and municipalities. War Balance counts support delivered from 2022 to August 2026, valued as described in the method: weapons at market value when delivered, loans at their gift value, its share of EU aid and the cost of hosting refugees, minus money flowing back. For Germany that comes to €74.8bn. Source: Bundesregierung: Bilaterale Unterstützungsleistungen der Bundesregierung für die Ukraine und Menschen aus der Ukraine (Stand 30.06.2026).
Money flowing back from the war effort
€21.4bn of aid and of Ukraine's purchases was spent in Germany; what its firms kept of it, €1.4bn, is taken off its support.
Companies, Russia and Russian owners
Its firms paid Russia less tax: €5.4bn (0.13% of one year's GDP). Germany's companies made less profit in Russia: €5.3bn (0.13% of one year's GDP). Germany earned less from Russian oil and gas stakes: €2.2bn (0.05% of one year's GDP). Russian owners kept less from their firms here: €1.3bn (0.03% of one year's GDP). Russia took €14.1bn from companies of this country (seizures and forced sales); not in the totals. Likely €10.0bn to €20.8bn; 0.34% of a year's GDP.
Indirect channels: hubs, refined oil, shipping
Russia kept less from its oil bought via other countries: €4.3bn (0.10% of one year's GDP). Germany kept more from shipping Russian oil: €51m (<0.01% of one year's GDP). Sold Russia goods its weapons need (chips, electronics, machine tools on the Common High Priority List): €278m in 2022–2026 (2026: January–August) (likely €264m to €914m); €859m in 2021. Shown as a marker, not added to the totals.
Compared with its neighbours and groups
In the map's ranking: number 10 of 32 economies toward Ukraine, as a share of GDP. EU countries: number 9 of 21 members toward Ukraine. G7: number 1 of 7 members toward Ukraine. NATO members: number 9 of 23 members toward Ukraine.
47 sources back its parts: 15 official statistics, 11 research reports, 0 press reports and 5 of this project's own estimates, plus 16 method inputs. By size, 23% of its parts are reported or measured (A–B), 72% modelled (C) and 5% rough indications (D).
Data coverage
Aid to Ukraine: reported Kiel Institute, to 31 Aug 2026, incl. EU share
Private donations: estimated national totals or a GDP-based estimate
Services trade with Russia: estimated includes shipping and insuring Russian oil (estimate)
Refugee hosting: reported national budget figures
Bought from Russia: reported reported 2021-2025
Sold to Russia: estimated partner data plus an estimate of goods reaching Russia via third countries
Bought from Ukraine: reported reported 2021-2025
Sold to Ukraine: reported reported 2021-2025
Energy switching cost: estimated modelled per fuel and month
Company taxes in Russia: reported KSE country figures
Money flowing back: estimated each euro followed to the economy where it was spent
Germany's support for Ukraine from 2022 to August 2026: €74.8bn, 1.8% of one year's GDP (likely 1.6% to 2.3%). It counts its aid (weapons at market value when delivered, loans at their gift value), its share of EU aid, its share of IMF and World Bank lending, the cost of hosting refugees, private donations, an estimate of undisclosed military aid and purchases from Ukraine against the no-war level, net of money flowing back.
Does Germany trade with Russia?
It bought €1.4bn from Russia in 2025 (€35.7bn in 2021), and sold €10.1bn to Russia. What counts here is the change in what Russia kept from that trade (taxes and profit, not sales) against a world without the war: Russia kept €72.6bn (1.7% of GDP) less than without the war, of which €21.9bn gas cut off by Russia.
Does Germany still buy Russian oil and gas?
Before the war (2018–2021), fuel was 78.7% of what it bought from Russia. In 2025 it bought €1.4bn of fuel and other goods from Russia, against €35.7bn in 2021; the section on what it bought from Russia by fuel splits it.
Is Germany helping Russia?
In money terms the net is +3.7% of one year's GDP (likely 2.6% to 5.0% toward Ukraine; very likely · >99%). Chance toward Ukraine: >99%; 100% of the other method choices agree. Russia kept €72.6bn (1.7% of GDP) less than without the war, of which €21.9bn gas cut off by Russia. The number counts money: weapons at their money value; votes, diplomacy and intent are not in it.
How much did Germany give Ukraine each year?
Support for Ukraine by year: 2022 €14.7bn; 2023 €14.9bn; 2024 €14.4bn; 2025 €18.7bn; 2026 (to August) €12bn. In total since 2022: €74.8bn (likely 1.6% to 2.3%).
How many Ukrainian refugees does Germany host, and what does it cost?
1,259,155 refugees from Ukraine, 15 per 1,000 residents. Counted as support for Ukraine: €35.5bn (0.85% of one year's GDP), the public cost of hosting refugees from 2022, after the host's gain on the work refugees do. For Germany: €36.9bn spent on refugees, less €1.4bn, its gain on the work refugees did here. That is about €7,316 per refugee per year (4,847,344 refugee-years).
Why does Germany's government give a different figure for its support to Ukraine?
Germany's federal government reports over €43.3bn in bilateral civil support and about €57.6bn in military support, as of 30 June 2026. Its military figure counts funds set aside for later years as well as what was delivered. It counts loans and guarantees at their face value. It leaves out its share of EU aid. Of the cost of hosting refugees it counts what the federal government paid, not the spending of states and municipalities. War Balance counts support delivered from 2022 to August 2026, valued as described in the method: weapons at market value when delivered, loans at their gift value, its share of EU aid and the cost of hosting refugees, minus money flowing back. For Germany that comes to €74.8bn. Source: Bundesregierung: Bilaterale Unterstützungsleistungen der Bundesregierung für die Ukraine und Menschen aus der Ukraine (Stand 30.06.2026).
 War Balance